

Summarize With AI


If your team still closes the numbers in scattered spreadsheets, with data copied from several systems and validations done in a rush, the problem is not only operational. It is a management problem. An automated financial dashboard solves precisely that gap: it turns dispersed data into actionable visibility, without depending on manual work every day.
For an SME, a SaaS startup, or a growing services company, this changes the game. The finance director stops losing time consolidating information. Leadership gains a clear reading of margin, cash, revenue, and costs. And the operation starts working with a single version of the truth.
What an automated financial dashboard is, in practice
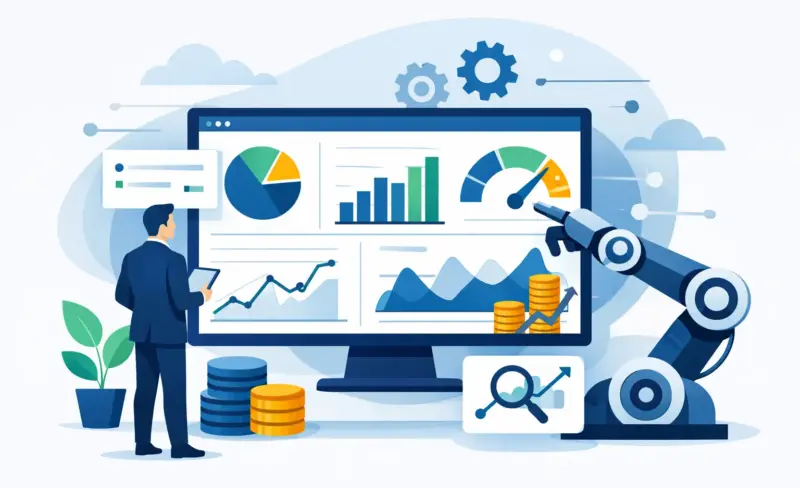
We are not talking about a pretty chart on a screen. An automated financial dashboard is a system that collects data from several sources, processes that information, organises it by relevant metrics, and updates the indicators without constant manual intervention.
In practice, this means connecting invoicing software, ERP, CRM, bank, payment platform, and even legacy spreadsheets, when they are still part of the operation. Then a clear logic is defined to consolidate the data and present what really matters to management.
The difference between a traditional report and an automated dashboard sits in time and in trust. The manual report is born late and prone to error. The dashboard is born to support the decision almost in real time, with consistent rules and less dependence on repetitive tasks.
Why so many companies still lack real financial visibility
The blockage is rarely a lack of data. Almost always it is an excess of data poorly connected to each other. There is invoicing in one system, collections in another, the sales pipeline in another, and operating costs scattered across several platforms. The result is predictable: every meeting starts with doubts about the numbers, instead of decisions about the business.
There is also a common error of approach. Many companies try to build dashboards before deciding what they need to manage. They end up with dozens of metrics on screen, but little clarity on liquidity, profitability, or revenue predictability.
A good automated financial system is not there to show everything. It is there to show what makes it possible to act. That filter makes all the difference.
Which metrics should go into the automated financial dashboard
It depends on the business model, but there is a hard core that almost always deserves attention. Available cash, accounts receivable, accounts payable, revenue by period, gross margin, fixed costs, variable costs, and variance against budget are base indicators for any management team.
In a SaaS business, it makes sense to add MRR, churn, LTV, CAC, and payback. In a services company, it may be more useful to cross invoicing with team utilisation, profitability by project, and average collection period. In an operation with several entities or cost centres, segmentation by business unit becomes critical.
The important point is this: the dashboard has to reflect the economic reality of the company, not only the structure of the systems that already exist. If the business is managed by contracts, clients, and margin per delivery, that is what the dashboard should show.
What separates a useful dashboard from a panel nobody consults
Most dashboards fail for three reasons. Either they show metrics without context, or they require too much effort to maintain, or they arrive too late to influence decisions.
A useful dashboard is simple to read and hard to corrupt. Each indicator has a clear definition, a known data origin, and an operational use. If the team argues about the number every week because nobody trusts the formula, the problem is not in the visualisation. It is in the data architecture.
It is also decisive to adapt the level of detail to the profile of whoever is looking. Management wants a fast reading and warning signals. The finance team needs the ability to drill down and reconcile. The ideal is not a single panel for everyone, but a coherent reporting structure with different views over the same data base.
How to implement without creating more complexity
This is where many projects skid. The temptation is to start with the tool. But the right path starts in the processes and in the decisions the dashboard should support.
First, the data sources need to be mapped and the gaps understood. Are there systems without integration? Fields filled in inconsistently? Critical data that only exists in manual files? Without this diagnosis, automation only speeds up confusion.
Then the management model is defined. Which indicators really matter? How often do they need to be updated? Who validates exceptions? Who receives alerts when a KPI leaves the expected range? This layer is strategic. It is what guarantees that the technology answers to the business and not the other way around.
Only then does the technical implementation come in: integrations, transformation rules, data normalisation, dashboards, permissions, and maintenance routines. When this is done well, the company stops depending on one person to “pull the numbers” before every meeting.
Integrations: where the real return sits
The true gain of an automated financial dashboard is not only in the visualisation. It is in the ecosystem of integrations that eliminates manual work and reduces human error.
When invoicing, payments, CRM, and accounting communicate with each other, the update stops being an administrative task and becomes a natural consequence of the operation. That reduces delays, increases trust in the data, and frees the team for analysis, control, and decision-making.
There are, however, trade-offs. It does not always pay to integrate everything right at the start. In many cases, it makes more sense to begin with the flows with the greatest financial impact or the greatest volume of manual work. Accounts receivable, payment reconciliation, and cash-flow visibility usually generate a faster return than overly ambitious projects from scratch.
The impact on financial management and on the operation
When financial information becomes accessible and up to date, the company gains speed. Leadership can see deviations earlier. The finance team reduces hours spent on consolidation. Sales and operations stop working with assumptions about revenue, collections, or profitability.
This has a direct effect on growth. Companies that control their cash better decide better when to hire, invest, or cut costs. Companies that measure margin by client or service can correct pricing and commercial focus faster. Companies with more reliable forecasts reduce risk.
It is not only a question of internal efficiency. It is a management advantage.
When it makes sense to move forward
If your team closes the month with excessive effort, if there are recurring doubts about basic numbers, or if leadership takes too long to have visibility over financial performance, a hidden operational cost already exists. And that cost grows as the business grows.
It also makes sense to move forward when the company is scaling without reinforcing the administrative structure in proportion. An automated dashboard helps precisely to increase capacity without creating more dependence on manual tasks.
On the other hand, if the underlying data is very disorganised, the first step may not be building the final dashboard. It may be tidying processes, standardising sources, and guaranteeing a minimum of consistency. Automating a chaotic system does not solve the chaos. It only makes it faster.
What to expect from a well-executed project
A good project does not only deliver a panel. It delivers a decision system. That includes well-defined business logic, relevant indicators, stable integrations, and a simple experience for whoever needs to use the information day to day.
This is where a specialist partner makes a difference. Not only on the technical side, but in the ability to translate financial objectives into operational automation with immediate impact. Haipe Studio works exactly on that frontier between strategy, execution, and ongoing management, so that the automation does not get stuck at the implementation phase and continues to generate return over time.
In the end, the right question is not whether your company needs more reports. It is whether it needs to decide with more speed, less error, and greater control. If the answer is yes, an automated financial dashboard stops being an interesting extra and becomes growth infrastructure.
The best time to gain financial visibility is not when the operation slows down. It is when there is still time to scale with control.


